Annual Ridership
Fiscal Year
(ending June 30) |
Annual Ridership
|
Average Daily Ridership
(All Routes)
|
|
All Routes
|
Larkspur*
|
Sausalito
|
Tiburon†
|
Angel Island |
Weekday
|
Saturday
|
Sunday/
Holiday
|
| FY 2025 |
1,582,632 |
952,087 |
377,595 |
141,517 |
111,433 |
4,481 |
4,605 |
3,672 |
| FY 2024 |
1,421,356 |
816,039 |
362,172 |
129,970 |
113,175 |
4,041 |
3,862 |
3,415 |
| FY 2023 |
1,155,682 |
583,966 |
351,149 |
117,112 |
103,455 |
3,208 |
3,430 |
2,907 |
| FY 2022 |
690,362 |
379,055 |
207,294 |
50,911 |
53,102 |
1,728 |
2,541 |
2,140 |
| FY 2021 |
89,861 |
75,921 |
6,663 |
7,277 |
n/a |
350 |
524** |
960** |
| FY 2020 |
1,712,507 |
1,148,981 |
423,991 |
139,535 |
n/a |
5,794 |
3,461 |
2,753 |
| FY 2019 |
2,470,204 |
1,644,783 |
629,954 |
195,467 |
n/a |
8,367 |
3,638 |
3,063 |
| FY 2018 |
2,578,137 |
1,660,272 |
726,010 |
191,855 |
n/a |
8,509 |
4,383 |
3,621 |
|
FY 2017
|
2,523,077
|
1,692,741
|
768,942
|
61,394
|
n/a |
8,203
|
4,585
|
3,747
|
|
FY 2016
|
2,545,122
|
1,753,484
|
791,638
|
n/a
|
n/a |
8,204
|
4,843
|
3,898
|
|
FY 2015
|
2,540,691
|
1,727,872
|
812,819
|
n/a
|
n/a |
8,219
|
4,953
|
4,083
|
|
FY 2014
|
2,470,583
|
1,677,050
|
793,533
|
n/a
|
n/a |
7,812
|
4,861
|
4,172
|
|
FY 2013
|
2,324,874
|
1,605,989
|
718,885
|
n/a
|
n/a |
7,465
|
4,482
|
3,685
|
|
FY 2012
|
2,195,414
|
1,526,375
|
669,039
|
n/a
|
n/a |
7,016
|
4,116
|
3,488
|
|
FY 2011
|
2,031,219
|
1,432,039
|
599,180
|
n/a
|
n/a |
6,532
|
3,615
|
3,237
|
|
FY 2010
|
1,922,095
|
1,338,764
|
583,331
|
n/a
|
n/a |
6,057
|
3,779
|
3,341
|
|
FY 2009
|
1,949,035
|
1,370,400
|
578,635
|
n/a
|
n/a |
6,273
|
3,681
|
2,999
|
|
FY 2008
|
1,979,843
|
1,414,588
|
565,255
|
n/a
|
n/a |
6,340
|
3,535
|
3,259
|
|
FY 2007
|
2,024,935
|
1,477,762
|
547,173
|
n/a
|
n/a |
6,590
|
3,561
|
3,015
|
|
FY 2006
|
1,870,169
|
1,402,668
|
467,501
|
n/a
|
n/a |
6,099
|
3,075
|
2,876
|
|
FY 2005
|
1,750,678
|
1,335,816
|
414,862
|
n/a
|
n/a |
5,719
|
2,997
|
2,549
|
|
NOTES:
* Larkspur ridership figures include special services such as service to San Francisco Giants baseball games at Oracle Park.
** Service operated June 26 & 27, 2021, only during FY 2021
|
Annual Ridership (Historical)
|
Fiscal Year
(ending June 30)
|
Annual Ridership
(All Routes)
|
Average Weekday Ridership
(All Routes)
|
Comments |
|
FY 2004
|
1,660,369
|
5,349
|
-
|
|
FY 2003
|
1,596,121
|
5,224
|
-
|
|
FY 2002
|
1,652,420
|
5,538
|
-
|
|
FY 2001
|
1,885,618
|
6,231
|
-
|
|
FY 2000
|
1,857,355
|
6,192
|
March 2000, service starts from
Larkspur to AT&T Park (then called
Pac Bell Park) for San Francisco
Giants baseball games. |
|
FY 1999
|
1,670,620
|
5,566
|
-
|
|
FY 1998
|
1,554,493
|
5,137
|
-
|
|
FY 1997
|
1,509,886
|
4,951
|
-
|
|
FY 1996
|
1,429,549
|
4,599
|
-
|
|
FY 1995
|
1,332,158
|
4,317
|
-
|
|
FY 1994
|
1,403,830
|
4,519
|
-
|
|
FY 1993
|
1,466,050
|
4,676
|
-
|
|
FY 1992
|
1,524,000*
|
-
|
-
|
|
FY 1991
|
1,506,000*
|
-
|
-
|
|
FY 1990
|
1,624,000*
|
-
|
In November and December 1989,
following the October 17, 1989,
Loma Prieta Earthquake, ferry ridership
increased by 60%. |
|
FY 1989
|
1,495,000*
|
-
|
-
|
|
FY 1988
|
1,452,000*
|
-
|
-
|
|
FY 1987
|
1,439,000*
|
-
|
-
|
|
FY 1986
|
1,279,000*
|
-
|
-
|
|
FY 1985
|
1,126,000*
|
-
|
December 1983 to November 1985,
the three Spaulding vessels were
sequentially taken out of service to be
converted from gas turbine to diesel to
cut operating costs. |
|
FY 1984
|
1,025,000*
|
-
|
|
FY 1983
|
1,070,000*
|
-
|
|
FY 1982
|
1,274,671
|
-
|
Ferry ridership records were set during
the January 1982 storms in Marin County. |
|
FY 1981
|
1,816,731
|
-
|
-
|
|
FY 1980
|
1,117,508
|
-
|
-
|
|
FY 1979
|
2,059,908
|
-
|
During the fuel crisis in 1978/1979, a
ridership record was set in May 1979,
when ferries carried 53,271 passengers
in a week. |
|
FY 1978
|
2,142,448
|
-
|
-
|
|
FY 1977
|
1,708,321
|
-
|
December 1976, service starts from Larkspur to San Francisco. |
|
FY 1976
|
1,103,810
|
-
|
-
|
|
FY 1975
|
1,087,804
|
-
|
-
|
|
FY 1974
|
1,061,494
|
-
|
-
|
| NOTE: * indicates ridership is rounded |
Ridership on Giants Ferry / Oracle Park Service
|
Season
|
Ridership
|
| 2025 |
49,711 through 7/30/25 |
| 2024 |
67,681 |
| 2023 |
62,042 |
| 2022 |
56,226 |
| 2021 |
33,754 |
| 2020 |
0 |
| 2019 |
45,186 |
| 2018 |
53,125 |
|
2017
|
66,394
|
|
2016
|
77,683
|
|
2015
|
75,601
|
|
2014
|
79,307
|
|
2013
|
80,782
|
|
2012
|
92,299
|
|
2011
|
94,385
|
|
2010
|
87,456
|
|
2009
|
64,797
|
|
2008
|
63,321
|
|
2007
|
72,617
|
|
2006
|
80,844
|
|
2005
|
78,399
|
|
2004
|
90,589
|
|
2003
|
55,133
|
|
2002
|
105,962
|
|
2001
|
79,815
|
|
2000
|
83,300
|
Highest Ridership Days
|
|
Larkspur
|
Sausalito
|
Total
|
|
Friday, July 21, 2006
Spare the Air Day (free rides by MTC/BAAQMD)
|
13,340
|
11,559
|
24,899
|
|
Friday, June 23, 2006
Spare the Air Day (free rides by MTC/BAAQMD)
|
10,522
|
6,295
|
16,817
|
|
January 6, 1982
Major Flooding in Marin County
|
12,275
|
4,118
|
16,393
|
|
Wednesday, October 31, 2012
World Champion San Francisco Giants Parade and Celebration
|
14,099
|
2,099
|
16,198
|
|
November 3, 2010
Giants World Series Victory Parade & Celebration
|
12,823
|
2,296
|
15,119
|
|
Friday, October 31, 2014
World Champion San Francisco Giants Parade and Celebration
|
10,622
|
1,365
|
11,987
|
|
July 30, 1977
A hot summer day
|
4,339
|
6,519
|
10,858
|
|
Saturday, April 28, 2012
South approach to the Golden Bridge, Doyle Drive, was closed for demolition
|
6,175
|
3,805
|
9,980
|
|
Sunday, April 29, 2012
South approach to the Golden Bridge, Doyle Drive, was closed for demolition
|
6,193
|
3,340
|
9,534
|
|
Saturday, October 6, 2012 Multiple events in San Francisco with Fleet Week, America’s Cup, Hardly Strictly Bluegrass, SF Giants Playoff game, and more
|
6,266
|
3,090
|
9,356
|
Saturday, January 10, 2015
The Golden Gate Bridge was closed to install a moveable median barrier |
5,617
|
3,308
|
8,925
|
|
Sunday, October 7, 2012
Multiple events in San Francisco with Fleet Week, America’s Cup, Hardly Strictly Bluegrass, SF Giants Playoff game, and more
|
4,687
|
2,250
|
7,937
|
NOTE: Ridership figures are for San Francisco Giants baseball games only and do not include other special event service.
Each season typically runs from April through September.
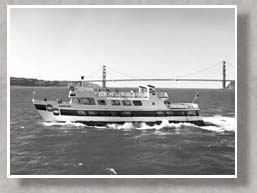
The retired M.V. Golden Gate
Photo copyright © Golden Gate Bridge, Highway and Transportation District. All Rights Reserved.